
Financial Distribution
Visual breakdown of revenue, expenses, and other financial metrics (values in millions)
Breakdown
“`
## Features of this Pie Chart:
1. **Clean, Professional Design** – Modern color scheme with a subtle gradient background
2. **Interactive Elements** – Hover over chart segments to see exact values and percentages
3. **Detailed Legend** – Clear breakdown of each category with values
4. **Responsive Layout** – Works well on both desktop and mobile devices
5. **Total Calculation** – Shows the sum of all values ($38 million)
6. **Visual Appeal** – Pleasing color palette with smooth animations
You can simply copy this code into an HTML file and open it in any modern browser to see the pie chart. The chart uses Chart.js, a popular JavaScript library for creating charts, which is loaded from a CDN for simplicity.
Deep Breath * Gratitude * Birch Forest
|
Elephant $100M Deer $10M Turkey $1M Rabbit $100K Mouse $10K |
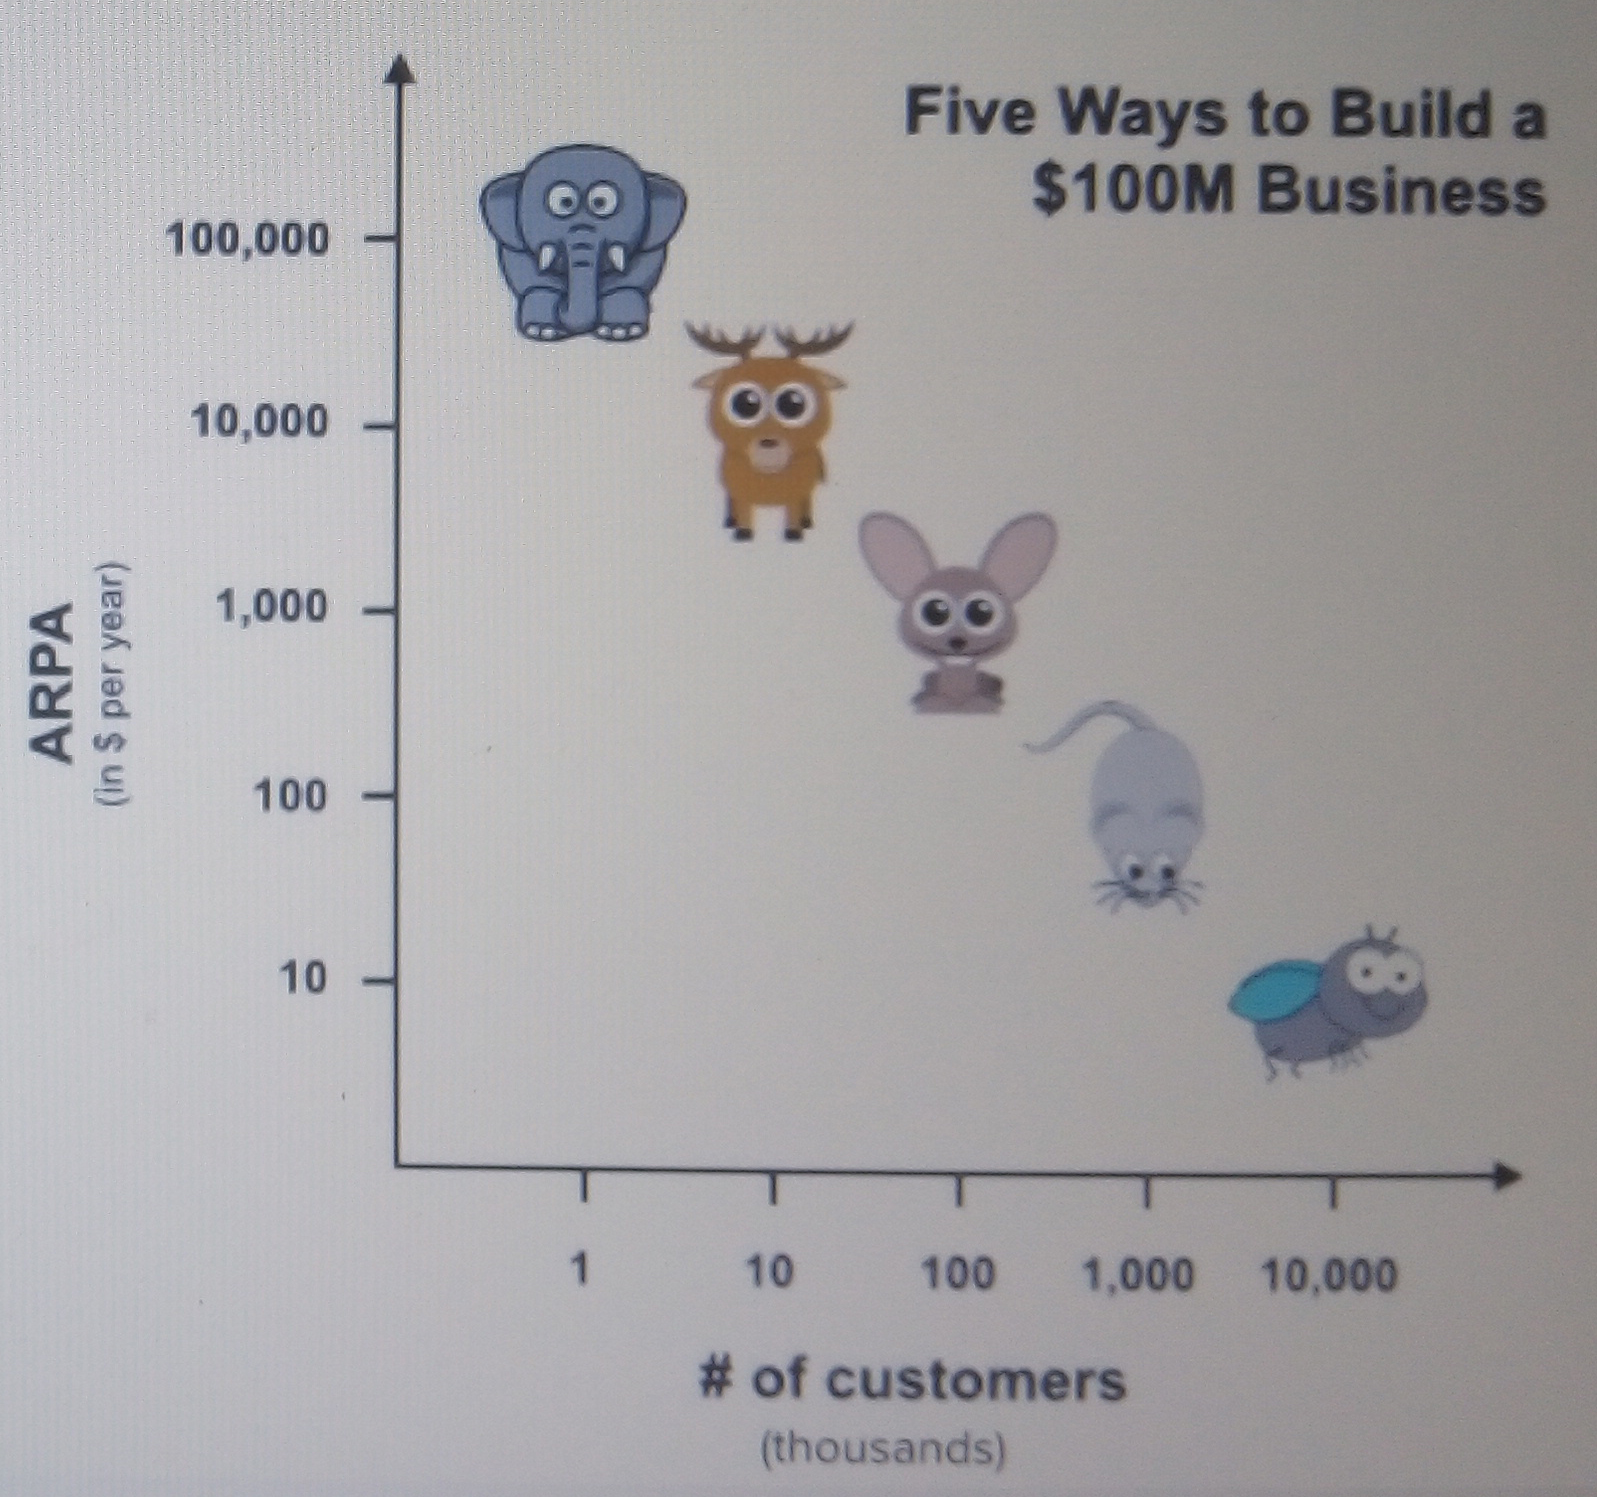 |
2 Elephants $200M 20 Deer $200M 300 Turkeys $300M 5,000 Rabbits $500M 10,000 Mice $100M |